|
trending
Sponsored Content
Aluvision: Modular & Sustainable Systems for Exhibits & Events EXHIBITOR Magazine Announces its 2025 FindIt Top 40, Honoring the Industry's Top Exhibit Producers EXHIBITOR Magazine Announces its 2025 Best of CES Award Winners EXHIBITOR Magazine Announces 2025 Portable/Modular Awards Winners EXHIBITOR Magazine Announces the EXHIBITORLIVE 2025 Best of Show Award Winners Exhibitor Group Partners with Maritz and Brumark to Reduce Waste and Track Carbon Footprint at EXHIBITORLIVE Freeman Acquires Tag Digital Enhancing mdg’s Digital Marketing Expertise and Global Reach Women In Experiential to Host Breakfast Event at EXHIBITORLIVE on March 19 GES Announces Key Leadership Updates submit your news
email newsletter
|
Associations/Press
HotStats Data Reveals Second Wave of Coronavirus Drowns APAC Hotel Profitability
6/3/2020
Asia-Pacific had to contend with round two of the coronavirus in April. A second wave of cases, in areas such as Singapore and Hong Kong, resulted in a new ramp up of containment measures. The result was a 124.1% YOY plunge in GOPPAR to a historical low of -$13.92 for the region. Demand contraction remained the main factor behind this grim performance. Occupancy in April was down by 52.9 percentage points compared to the same time a year ago, and average rate declined by 39.0%, resulting in a RevPAR falling 83.8% YOY. With other revenue centers virtually closed, there was nothing to compensate for the rooms slump, and TRevPAR fell by 83.3% YOY, hitting its lowest level on record. Expenses across the board also continued to fall in April. Total labor costs were slashed by 49.5% YOY, led by cuts in rooms (down 53.3% YOY) and F&B (down 51.3%). Overhead costs followed suit, falling by 51.3% as credit card commissions evaporated and utility expenses decreased by 54.0% YOY. In all, profit conversion in APAC was recorded at -50.9% of total revenue, 86.2 percentage points below April of 2019. The silver lining is that month after month hoteliers in the region have become more efficient at minimizing the impact of revenue decreases on their bottom-lines. The flex percentage is an indicator that measures how much of each dollar lost in revenue the operation is able to retain in its profit as a result of cost-saving efforts. The higher the flex percentage, the lower the translation of revenue contractions into profit declines. In APAC, flex has been consistently increasing month after month, from 21.5% in January to 47.4% in April. This increased operational efficiency will be the cornerstone of profit recovery once countries start to re-open and travel resumes. 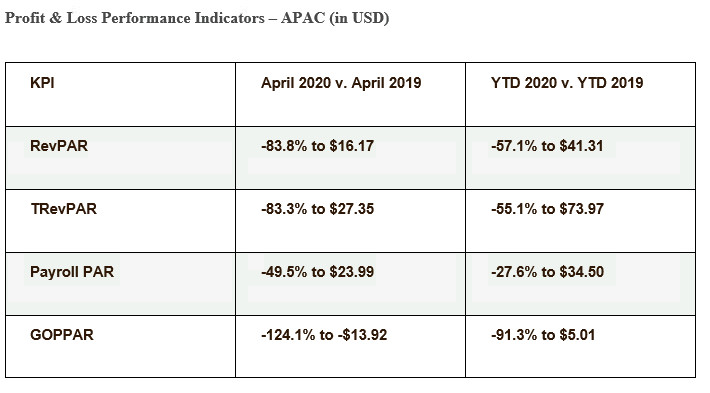
Singapore Despite a second wave of confirmed cases, Singapore was the best-performing market in the region. After recording a negative GOPPAR value in March, profit-per-room jumped to $31.37 in April. And although this number is still 68.6% lower compared to 2019, it is a green shoot pointing toward recovery. The Singapore government identified citizens, permanent residents and long-term pass holders returning to the country from abroad as the major source of the resurgence in coronavirus cases. Subsequently, it instituted a mandatory 14-day quarantine for this type of inbound travelers as a way of containing the spread. Consequently, hotels across Singapore were turned into quarantine facilities to accommodate the heightened need for isolation quarters. The government-led demand fueled occupancy in the market, which, albeit 32.0 percentage points down YOY, reached its highest level since January at 53.1%. Average rate was down 64.8% YOY, as luxury properties, such as Conrad Centennial Singapore, InterContinental Singapore and Grand Park Orchard, closed to the general public and sold their rooms exclusively to the government. As a result, April RevPAR recorded a 78.0% YOY drop. With little contribution from ancillary revenue, TRevPAR was down 74.7% YOY, but showed a marked deceleration on its way down when looked at on a month-over-month basis. February and March results recorded 46.0% and 49.6% MOM TRevPAR contractions respectively, but in April the MOM fall was 16.8%. Singaporean hoteliers were also able to slash labor costs in April, the result of a government assistance program that paid local employees up to 75% of their salaries. Total hotel labor costs plunged by 86.9% YOY as a result, playing a huge role in the market’s profit margin. In the face of this unprecedented crisis, hotels in Singapore recorded a healthy 45.3% profit conversion of total revenue in April, placing 8.8 percentage points below the same month of the previous year. 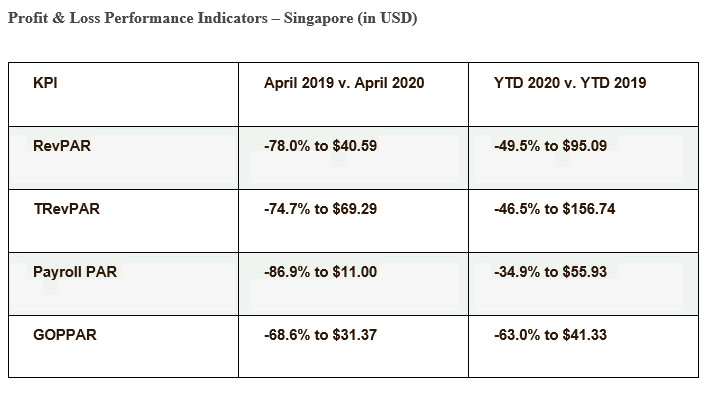
Hong Kong Hong Kong also saw a new surge of coronavirus cases as a result of repatriated citizens, spurring a series of containment measures that included the closure of bars and all nonessential businesses, the prohibition of dine-in services at restaurants and increased travel restrictions. This further eroded profitability in a market that was already in recession since the start of political protests in June of 2019. GOPPAR in April recorded a 149.9% YOY decline, marking a new all-time low. According to the Hong Kong Tourism Board, the market saw barely 4,100 arrivals in April, compared to the 5.57 million in the same month of 2019. Occupancy nosedived by 74.3 percentage points YOY, to 12.1%, and average rate followed with a 51.1% fall, resulting in a 93.1% YOY plunge in RevPAR and an 87.2% drop in TRevPAR. Cost-saving efforts fell short in the face of such a massive revenue contraction. Total labor costs were cut by 21.5% YOY, focused mainly on operated departments such as rooms (down 20.9% YOY) and F&B (down 22.7% YOY). Overhead expenses were also down by 38.8% YOY, fueled by an 88.0% cut in credit card commissions and a 78.7% decline in Sales & Marketing expenses. Consequently, profit conversion in Hong Kong was recorded at -157.2% of total revenue in April, 197.5 percentage points below the same month of 2019. 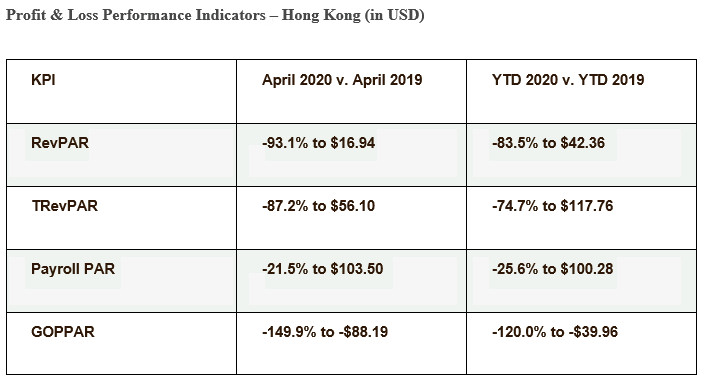
About HotStats HotStats provides a unique profit-and-loss benchmarking service to hoteliers from across the globe that enables monthly comparison of hotels’ performance against competitors. It is distinguished by the fact that it maintains in excess of 500 key performance metrics covering 70 areas of hotel revenue, cost, profit and statistics, providing far deeper insight into the hotel operation than any other tool. The HotStats database totals millions of hotel rooms worldwide. For more information, visit www.hotstats.com. Contact: questions@exhibitormagazine.com |
FIND IT - MARKETPLACE
|
|
||||||||||||||||||||||||||||
|
|
||||||||||||||||||||||||||||
|
TOPICS Measurement & Budgeting Planning & Execution Marketing & Promotion Events & Venues Personal & Career Exhibits & Experiences International Exhibiting Resources for Rookies Research & Resources |
MAGAZINE Subscribe Today! Renew Subscription Update Address Digital Downloads Newsletters Advertise |
FIND IT Exhibit Producers Products & Services All Companies Get Listed |
EXHIBITORLIVE Sessions Exhibit Hall Exhibit at the Show Registration |
ETRAK Sessions Certification F.A.Q. Registration |
EDUCATION WEEK Overview Sessions Hotel Registration |
CERTIFICATION The Program Steps to Certification Faculty and Staff Enroll in CTSM Submit Quiz Answers My CTSM |
AWARDS Exhibit Design Awards Portable/Modular Awards Corporate Event Awards Centers of Excellence |
NEWS Associations/Press Awards Company News International New Products People Shows & Events Venues & Destinations EXHIBITOR News |
||||||||||||||||||||
|
||||||||||||||||||||||||||||


